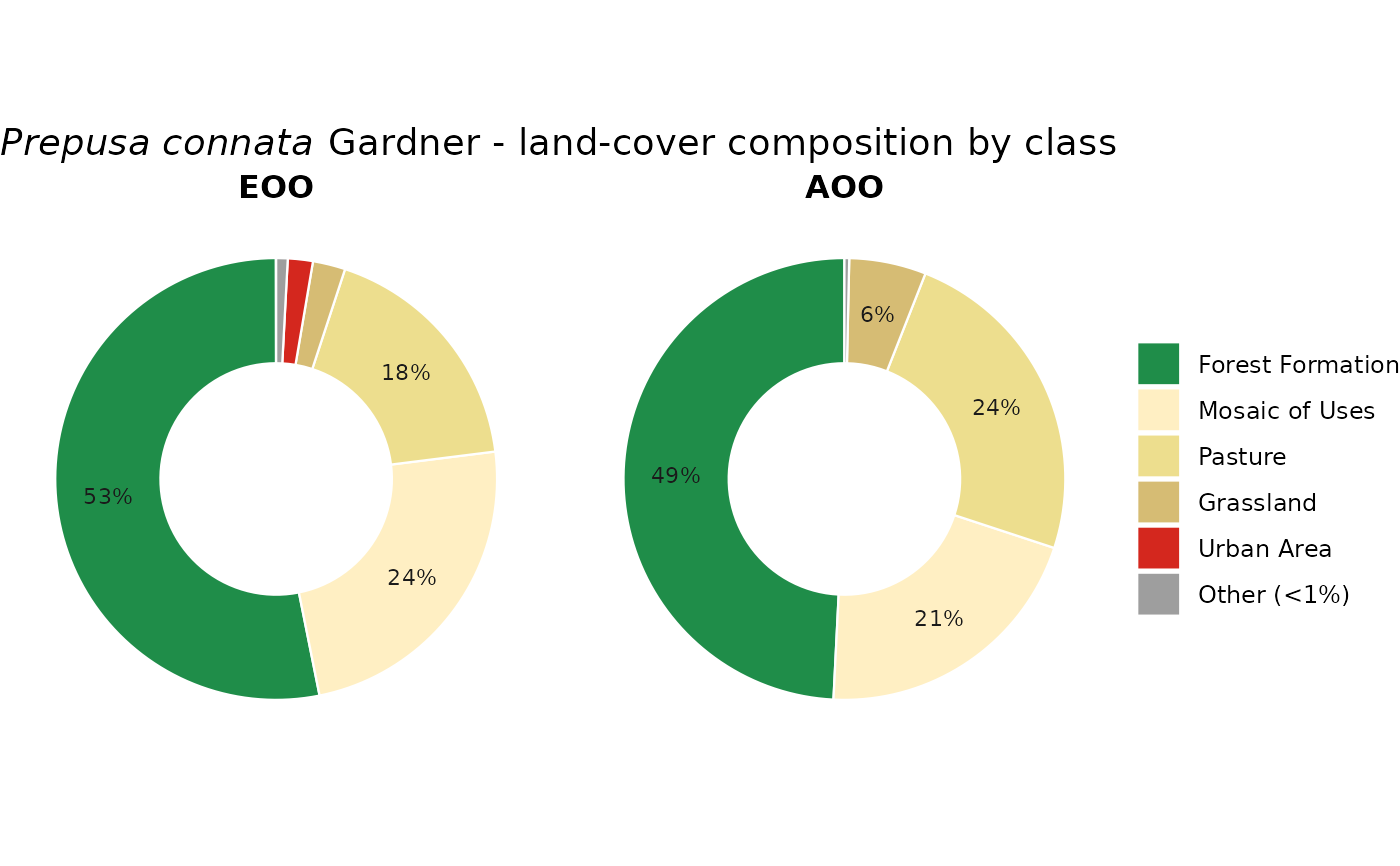
Two side-by-side donut (ring) charts summarising the MapBiomas composition of
the Extent of Occurrence (EOO) and Area of Occupancy (AOO) of a species, in
the official MapBiomas colours. Slices can be individual land-cover classes
(by = "class") or the four conservation groups
(by = "group"). Designed to be exported as a transparent-background
PNG (all panel/plot/legend backgrounds are transparent), and the interactive
plotly version (via mas_plotly) adds outside labels with
leader lines and a transparent export.
Arguments
- assessment
A
geoconv_assessmentfromassess_species(run withmapbiomas = TRUE).- species
Optional species name.
NULL(default) uses the first assessed species.- by
"class"(default) for one ring slice per MapBiomas class, or"group"for the Natural / Altered / Water / Other summary.- lang
"en"(default) or"pt"for slice labels.
Value
A ggplot object (with mappingAS metadata attached in attribute
"mas" so mas_plotly can build the interactive donut).
Stops with an informative message if no class data are available.
Examples
# \donttest{
occ <- read_occurrences(system.file("extdata", "example_occurrences.csv",
package = "mappingAS"))
# reads MapBiomas (one year; the multi-year habitat trend is skipped)
res <- assess_species(occ, year = 2024, infer_decline_from_habitat = FALSE,
verbose = FALSE)
plot_conversion_donut(res, by = "class")
 # }